Here (below) you can see an example-analysis of motion-capture data. The motion capture data is from the The BVH Conversion Release of CMU's Motion Capture Database, whch you can find here: CMU's Motion Capture Database (BVH). I used the first bvh-file of the first zip-file in the link-list. The used bvh-file has the name "01_01.bvh".
Before you will see the analysis as pictures, I will add some ideas on what could/should be analysed, even if I myself do not have the possibilities at hand, to make that research so far. I will relate to Laban Movement Analysis
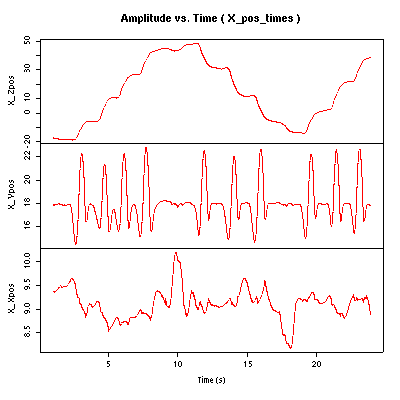
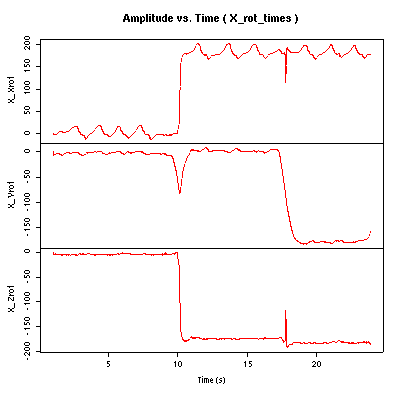
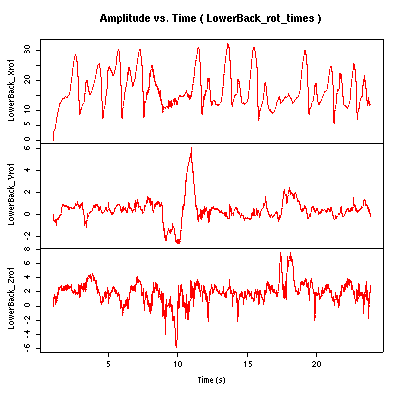
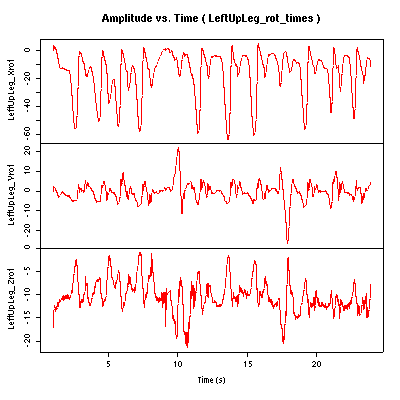
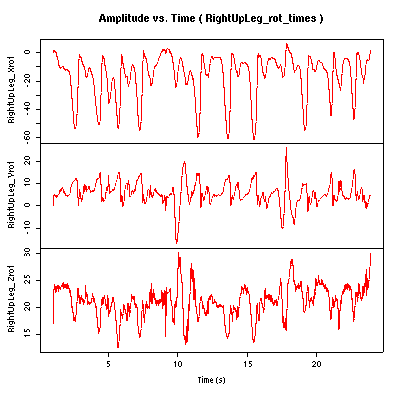
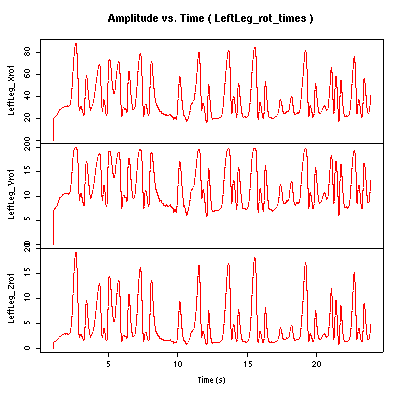
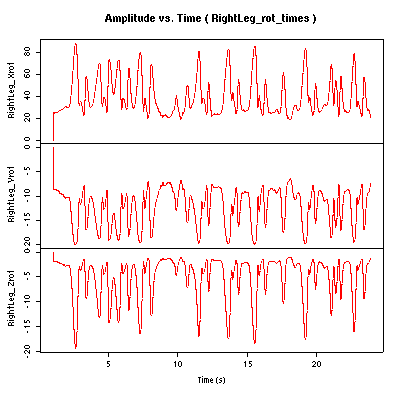
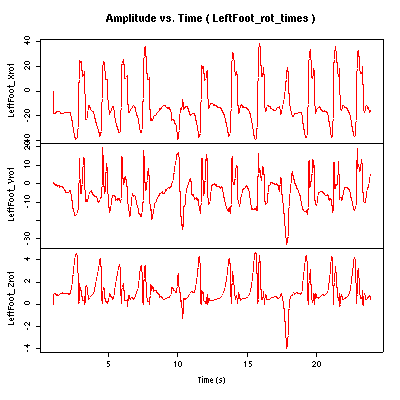
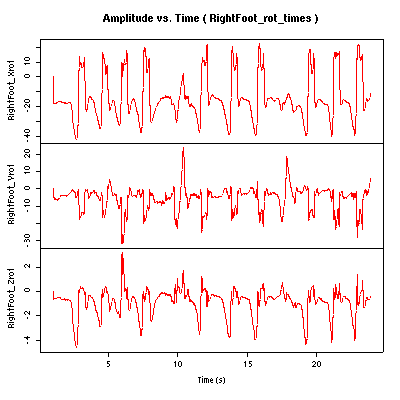
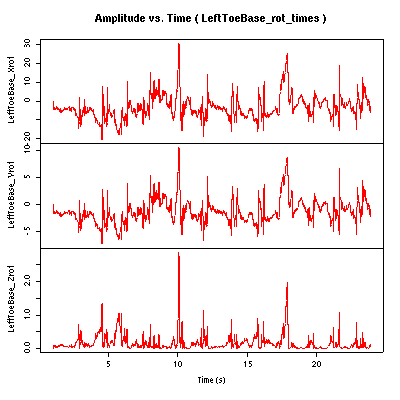
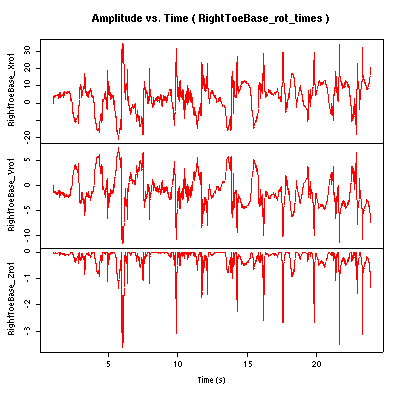
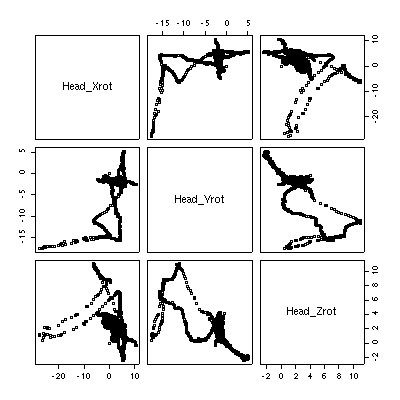
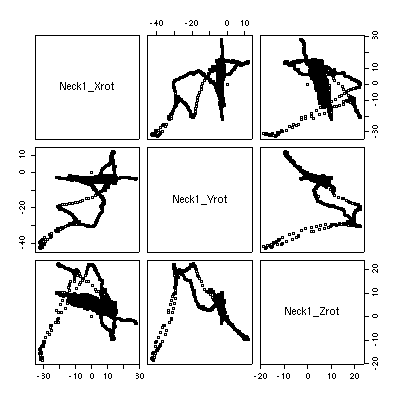
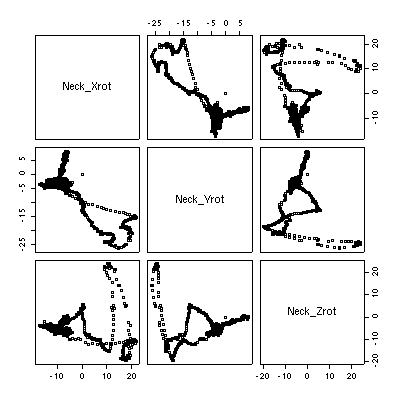
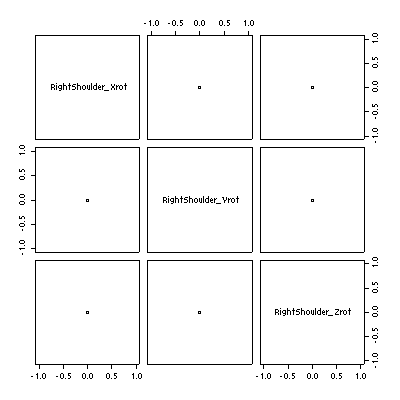
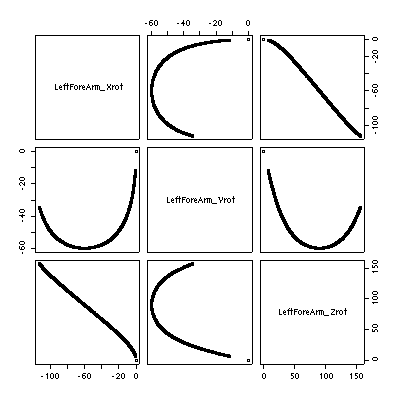
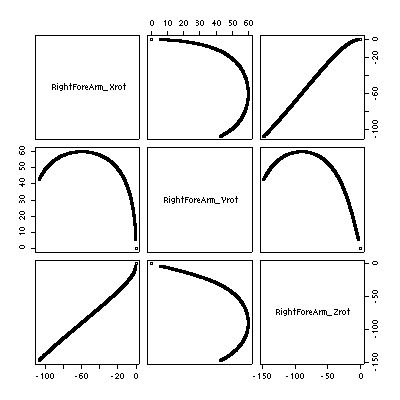
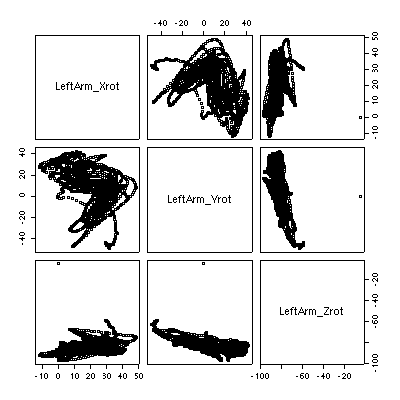
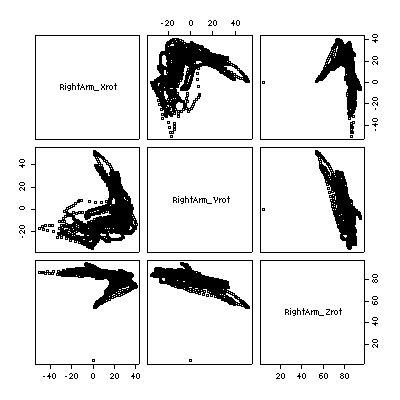
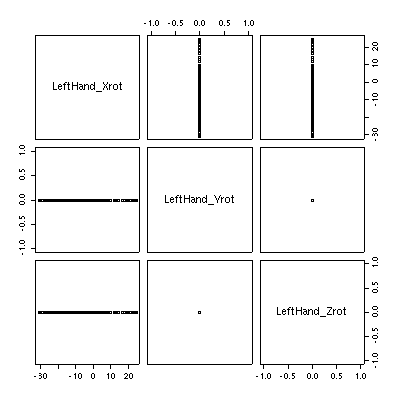
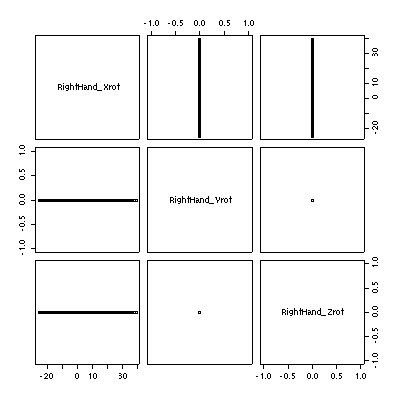
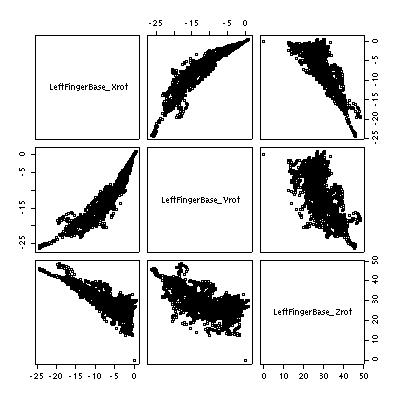
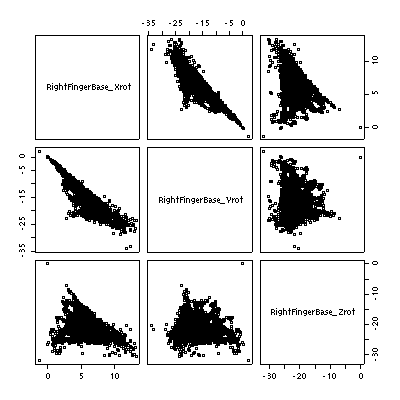
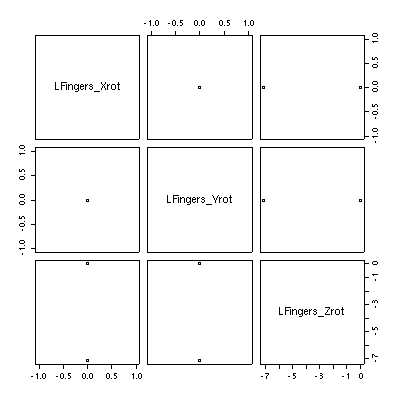
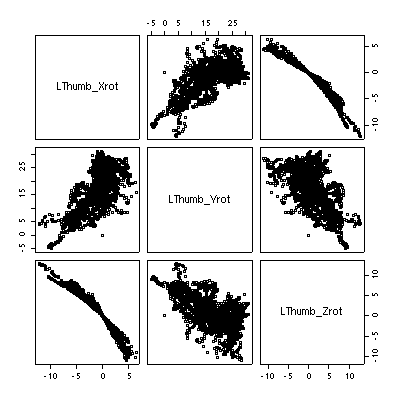
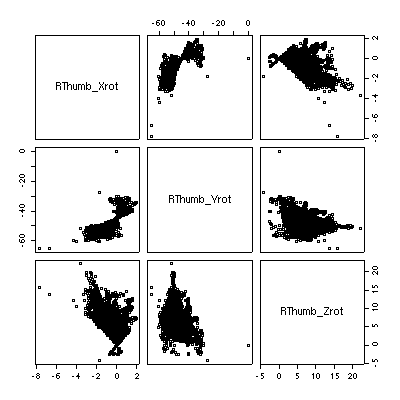
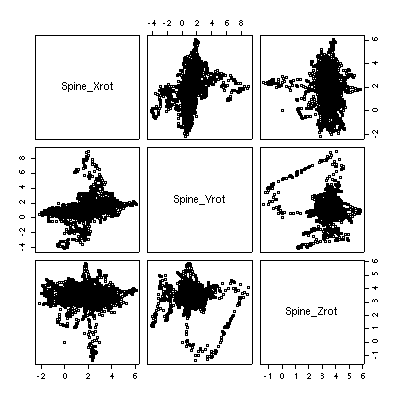
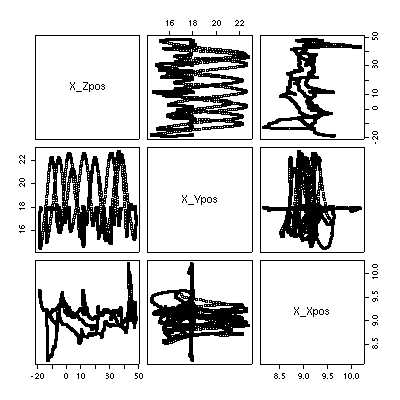
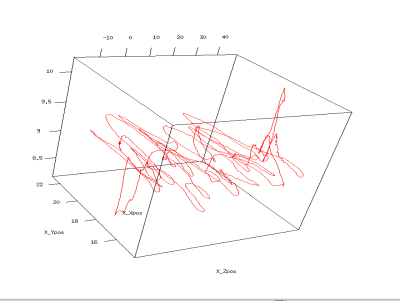
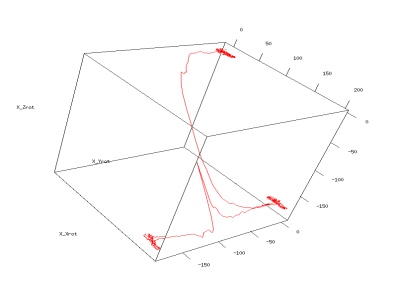
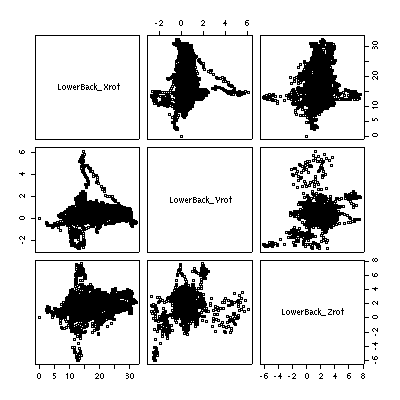
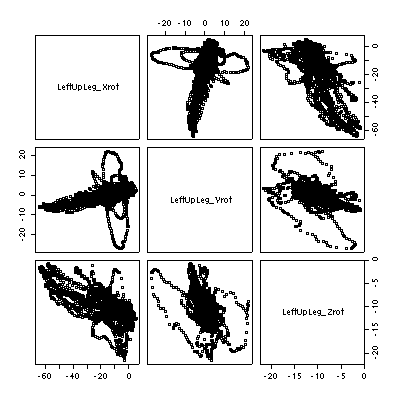
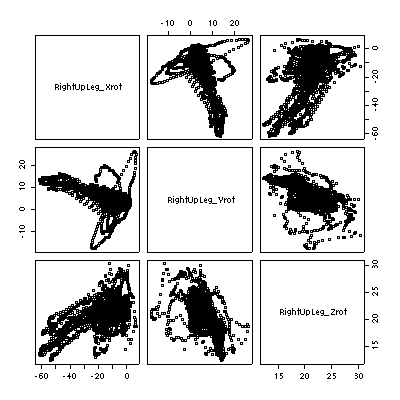
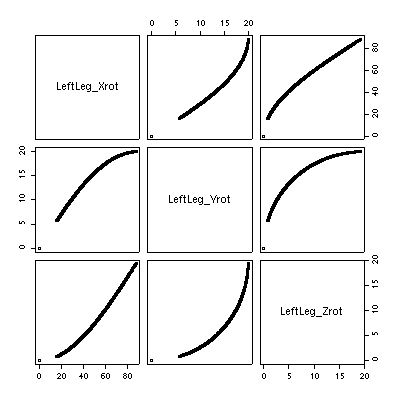
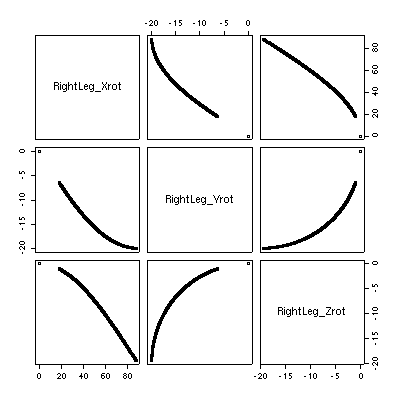
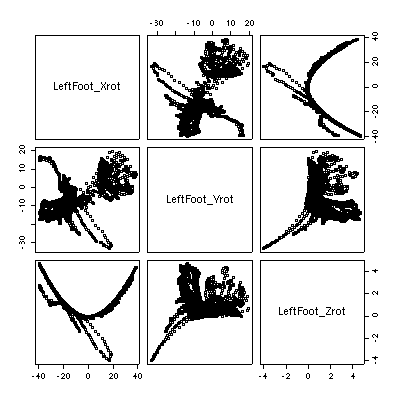
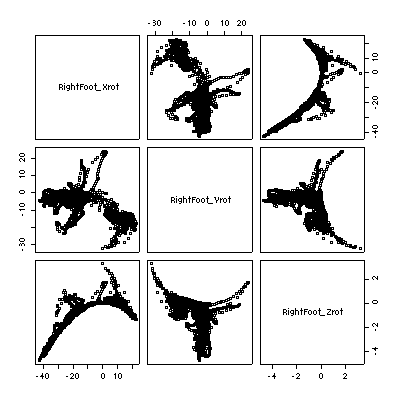
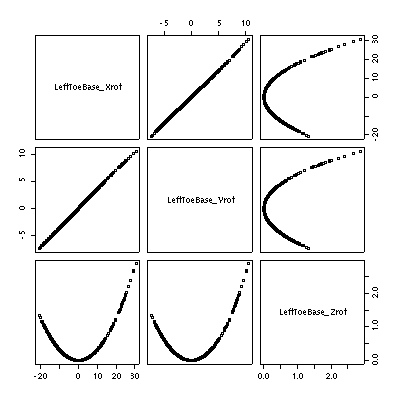
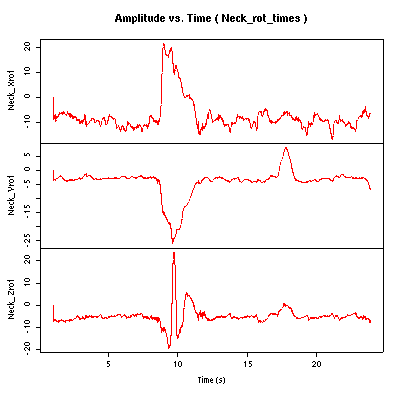
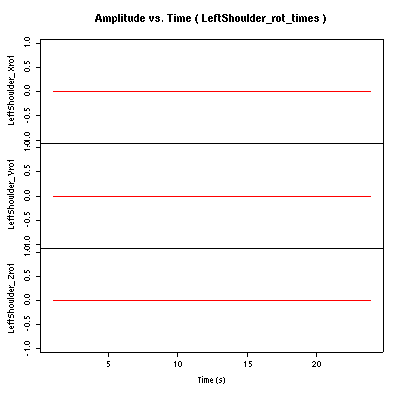
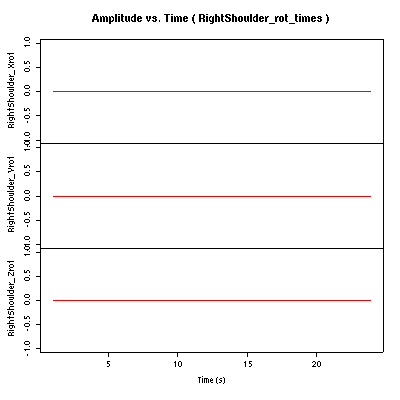
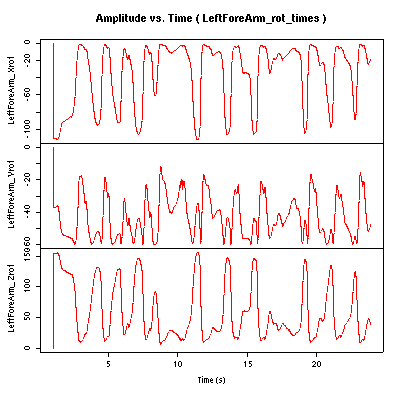
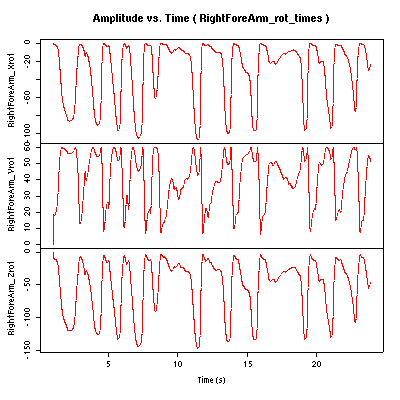
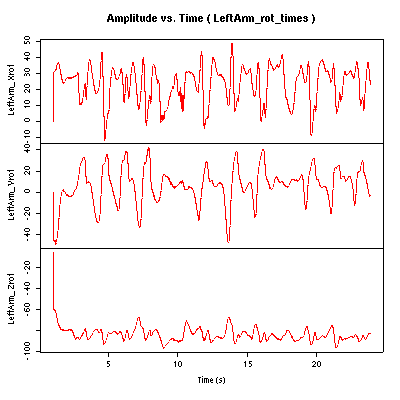
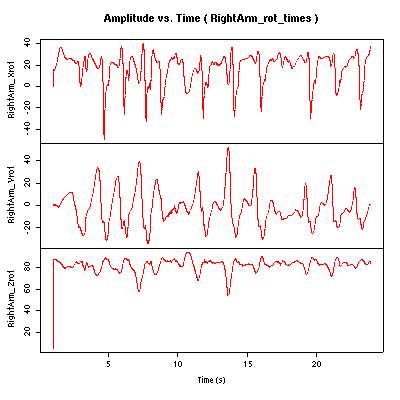
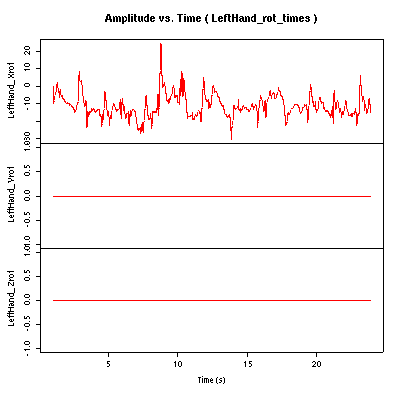
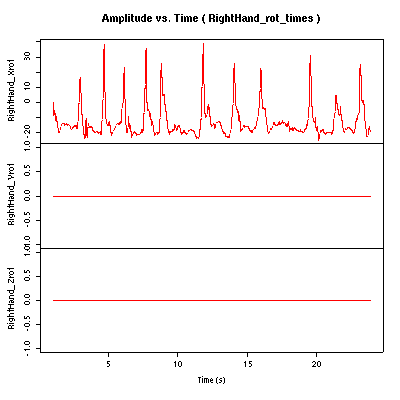
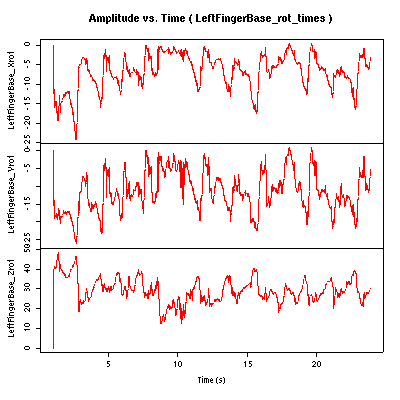
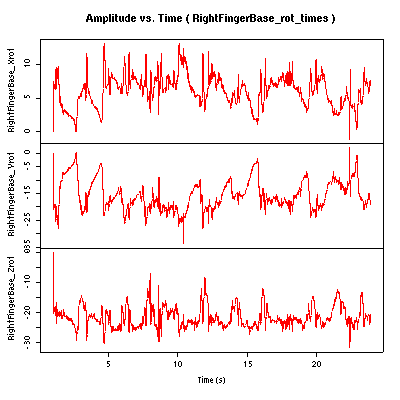
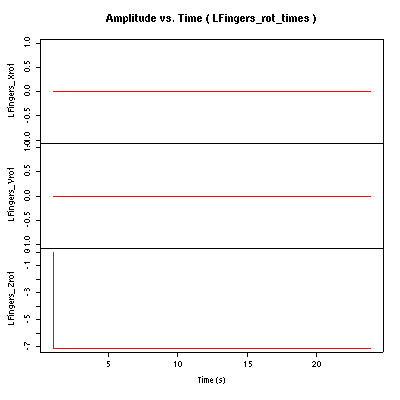
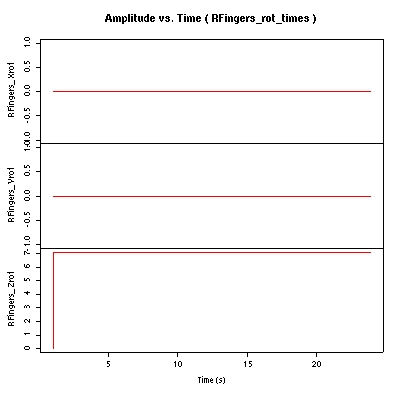
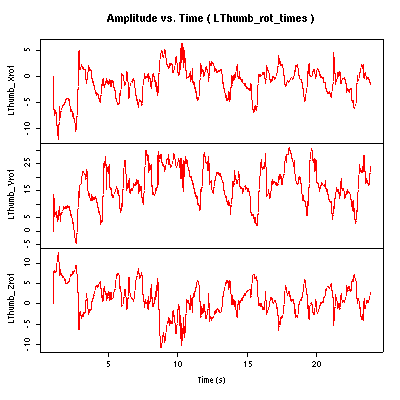
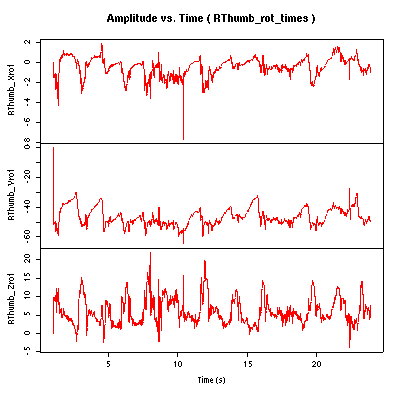
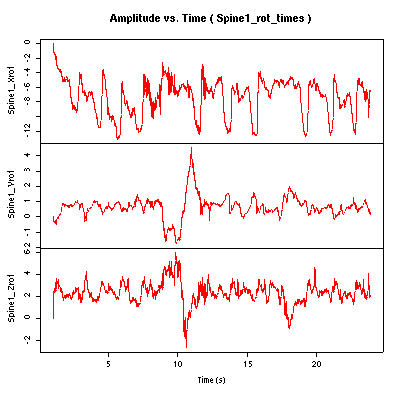
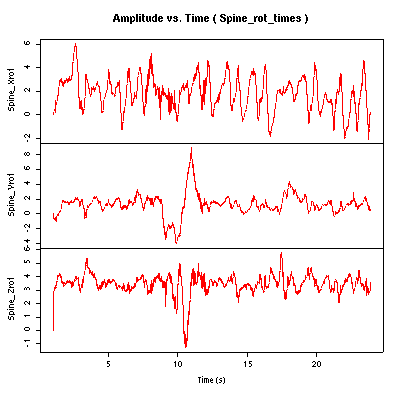
The analysis-example here is just to look all the data from the captured movement and to display all three values (channels) for each of the joints against each other of the three (x,y,z).
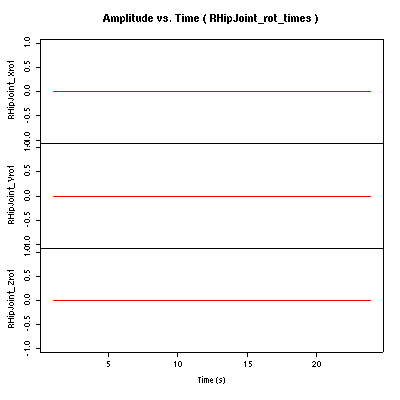
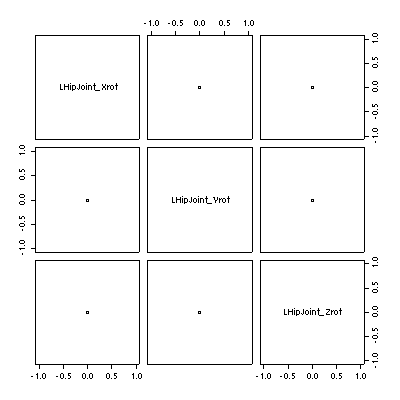
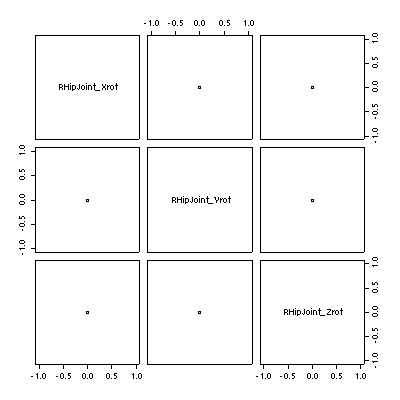
As you can see in the data set, there are some sets with only 0-values. Possibly these values were not meaured, but are part of the data file. Or maybe there were conversion problems. (I think it was mentioned on somewhere on the CMU's pages, but this is an ad-hoc analysis, so I could add the explanations later.)
What you can see easily, is, that there are patterns in the
used (in german I would say:) "Phasenraum".
The reason can be the kind of movement that was captured as well as
the degrees of freedom of the joint we look at.
A more detailed analysis could follow, but this text here is
an example on what I think could be interesting. It's not
intended to be a complete research.
As coming from the Laban Movement Analysis I think,
that analyzing the data in terms of Laban Movement Analysis
(scale analysis) could also be interesting. For each joint
as well as chains of joints (the boney connections, as
Irmgard Bartenieff
would call it (my translation from the
german "knöcherne Verbindung" back to english))
one could look for the movement patterns in space.
Somehow, the pictures below already display this.
But for a more Laban-like analysis, one would use the
directional symbols, which Laban used.
What to measure:
What advantages to get from such an analysis:
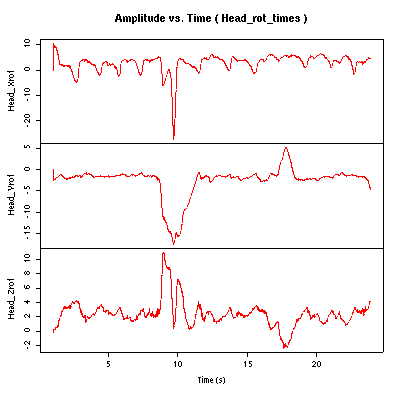
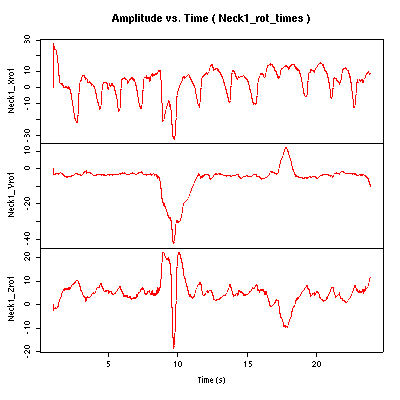
It also could be looked at timely patterns, which then could be analysed with mathematical precision and be related to what Laban called "Antrieb" (or "Effort" in english). This would need more investments then just some hours of providing that page, but I think it could bring some quite interesting results.
On the one hand, with motion capturing one has only raw data, which are analysed just mathematical, and are not really something, (for example) a dancer might be interested in. It's "just science" and as thus rather distant to "real life".
On the other hand, the inter-observer differences in the classifications done by movement observers are especially large in the effort ratings (compared to other Laban categories). This is not just what I experienced, this is also what CMA's (Certified Movement Analysts) say from their experience. At the EUROLAB e.V. conference (october 2008 in Berlin), Prof. Dr. Hedda Lausberg, who researches on movement analysis with support of video-work (using the ELAN-software to achieve this), also emphasized it in her presentation. So, the Effort-ratings are quite unstable between the observers. (One reason for sometimes doing such ratings in a group.)
To get a better inter-observer accordance, I think it would be
necessary to analyze movements in a way, in which physicist
analyze it: to have the position in space and derive it
(mathematical operation of derivation)
over the time to get timely derivatives (position, speed,
acceleration and higher derivatives).
As an engineer this kind of thinking is quite common to me.
Don Herbison Evans
once had written a paper on a similar
thing, but as far as I know he did not linked this to
the Laban Movement Analysis category "effort".
(For details look foor his papers.)
When there would be a measured dataset and compared to the ratings of (trained and untrained) observers, one can find out, which kind of movments how many people would classify as "sudden", and which (and by how many observers) as "sustained". (And also nuances in between those poles could be looked for in the ratings.)
Sociologists for example have such methods to find out classifications of a lot of people, looking for something like an "average" (or a main cluster of) rating and later can say, that the one or other observer is rather tending to the one or the other pole of the bipolar classification (of the time effort in this example).
With such a kind of analysis, one could bring together the so called "objective" measurements and the so called subjective (or inter-subjective) ratings (classifications). To say something heretic: one also could think about the computer doing the Laban-Movement-Analysis completely.
This means two things:
There are also other categories in the Laban Movement Analysis field, for example Body and Shape. Body and shape could be analysed also with the Laban Analysis of the motion capture data. But I will not go further into detail for now.


In the following two pictures, "X_" is the misnomer for the hips here,
so that means,
it's HIP_pos and HIP_rot (HIP_Xpos, HIP_Ypos, ... HIP_Xrot, ...)
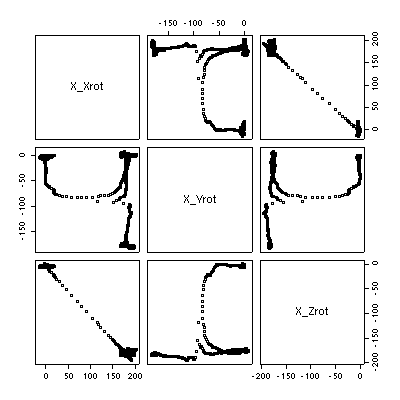

In the following two pictures, "X_" is the misnomer for the hips here,
so that means,
it's HIP_pos and HIP_rot (HIP_Xpos, HIP_Ypos, ... HIP_Xrot, ...)